Are you looking to enhance your network management skills and keep a close eye on network events and issues? Configuring a Syslog server in Cisco Packet Tracer is an essential skill for any network administrator or IT professional. In this detailed guide, we will walk you through the step-by-step process of setting up a Syslog server, ensuring that your network stays secure and efficient. Let’s get started!
Getting Started with Syslog Server Configuration
In this section, we’ll cover the basics of what a Syslog server is and why it’s crucial for network management.
What is Syslog and Why is it Important?
Syslog is a standardized protocol used for sending, receiving, and storing log messages on various devices within a network. It plays a critical role in network monitoring, troubleshooting, and security.
Benefits of Configuring a Syslog Server
Configuring a Syslog server offers several advantages, including:
- Centralized Logging: All log messages are collected in one location for easy access and analysis;
- Real-time Alerts: Immediate notification of network issues or security breaches;
- Historical Data: Archiving logs for compliance, auditing, and historical analysis.
Setting up Cisco Packet Tracer
Before configuring the Syslog server, you need to ensure that Cisco Packet Tracer is set up correctly.
Step 1: Download and Install Cisco Packet Tracer
If you haven’t already, download and install Cisco Packet Tracer from the official website.
Step 2: Launch Cisco Packet Tracer
Open the application and ensure you have administrative privileges.
Configuring Syslog on Cisco Packet Tracer
Now that Cisco Packet Tracer is ready, let’s dive into the steps for configuring Syslog.
Step 3: Access the Device
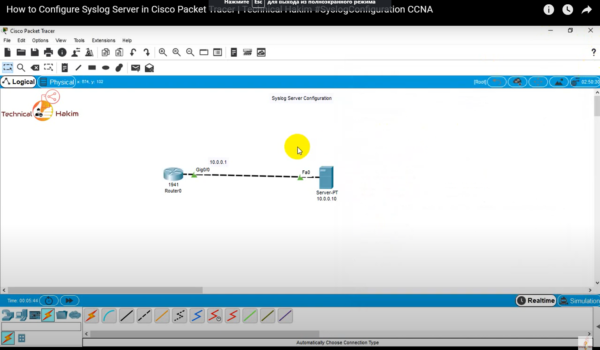
- Open Packet Tracer and load your network topology;
- Select the device you want to configure for Syslog.
Step 4: Access the Command Line Interface (CLI)
To configure Syslog, you need to access the device’s Command Line Interface (CLI).
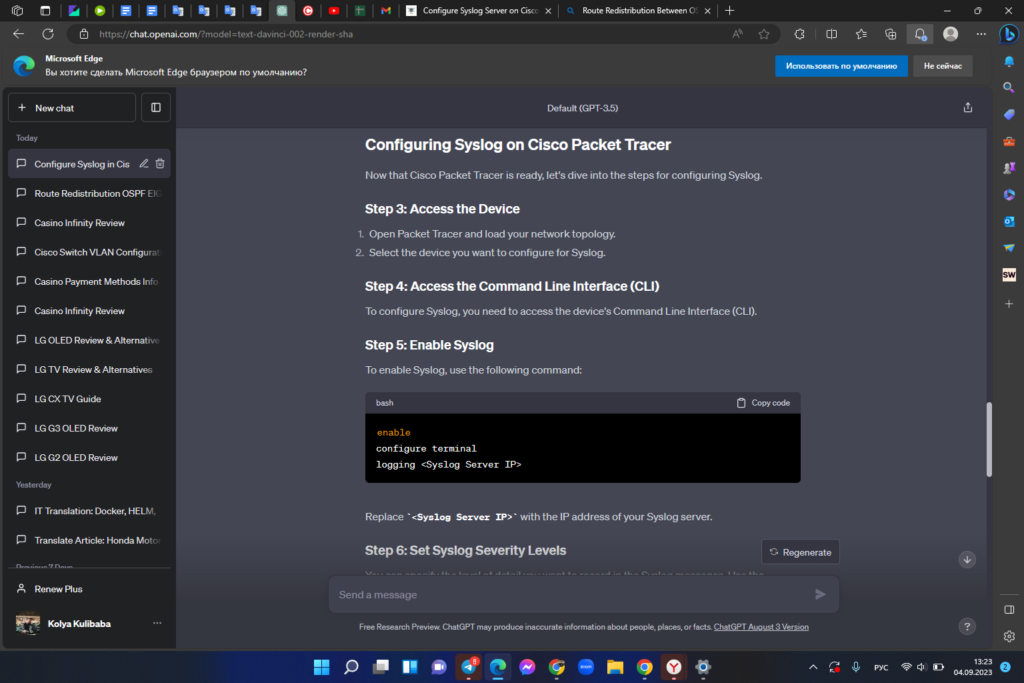
Step 5: Enable Syslog
To enable Syslog, use the following command:

Replace <Syslog Server IP> with the IP address of your Syslog server.
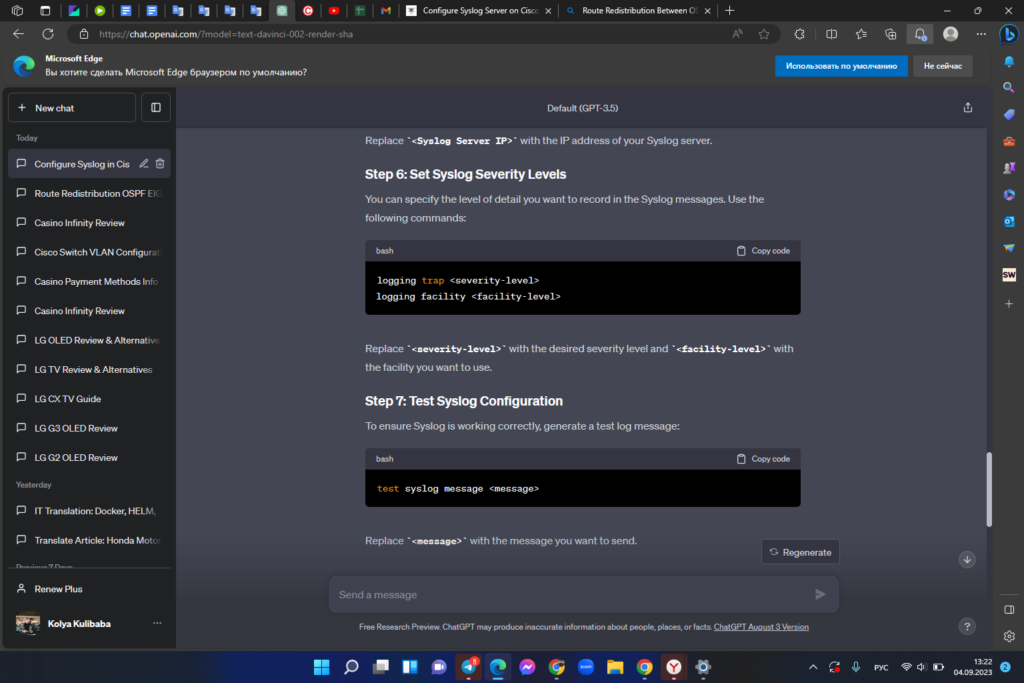
Step 6: Set Syslog Severity Levels
You can specify the level of detail you want to record in the Syslog messages. Use the following commands:

Replace <severity-level> with the desired severity level and <facility-level> with the facility you want to use.
Step 7: Test Syslog Configuration
To ensure Syslog is working correctly, generate a test log message:

Replace <message> with the message you want to send.
Analyzing Syslog Data
Now that Syslog is configured, it’s essential to understand how to analyze the generated log data.
Step 8: Access Syslog Data
You can access Syslog data through various means, including the command line or a graphical interface provided by your Syslog server software.
Step 9: Interpret Syslog Messages
Syslog messages contain valuable information about network events. Learn how to interpret them to identify and address issues.
Conclusion
Configuring a Syslog server in Cisco Packet Tracer is a crucial step in effective network management. By following these steps, you can centralize your network logs, receive real-time alerts, and maintain historical data for analysis and compliance purposes. Stay proactive in managing your network and ensuring its security.
FAQs
The default Syslog severity level in Cisco Packet Tracer is level 6 (Informational).
Yes, you can configure multiple Syslog servers in Cisco Packet Tracer by specifying multiple IP addresses in the logging command.
You can filter Syslog messages by severity level, facility, or specific keywords, depending on the capabilities of your Syslog server software.
While the basic Syslog configuration is similar across Cisco devices, there may be variations depending on the specific device model and software version.
